What’s a KPI?
If I had to define them in one sentence, I’d say: If your business looked in the mirror, KPIs are what would be staring back at it. But, since I have more than one sentence, I’ll elaborate.
KPI stands for Key Performance Indicator. A KPI is a piece of tracked and trended information that helps explain how your business (or a sub-unit of it) is doing. Imagine someone asks you “How’s business?” and you respond, “It’s going great!”
This person is a bit nosey, so they follow up with, “How do you know it’s going great?”
Would you rather answer, “It just feels like it’s going really well,” or “First quarter sales were up 20% vs last year, gross margins are up 2% since the beginning of the year, and we’ve cut the cost of customer acquisition in half since we started advertising on Facebook.”
I’d lean toward the latter answer! Building a focused set of accurate, up to date KPIs helps you understand the important drivers of business success. In many cases, setting up KPIs can be simpler than you think. Many KPIs apply to almost all businesses, so you can follow some best practices. And the ones that are unique to your business? Those are the areas of your business you’re already an expert in, so don’t worry.
How is a KPI different from a metric?
Contrary to common belief, KPI and metric are not interchangeable words. The critical word in “key performance indicator” is key. If you have pages and pages of metrics, consider the metrics you want to see on page one the KPIs. There may be lots of metrics you like to have tracked in case you need to evaluate them at some point. That’s fine, track away! But your KPIs are the metrics you look at regularly and simply can’t live without. All KPIs are metrics but not all metrics are KPIs.
If it’s not actionable, it’s not a KPI
The first test you can give a potential KPI is whether or not you can take action and improve it. KPIs are only useful if it’s clear what actions you can take to improve or maintain them. If you’re tracking sales vs. forecast as a KPI, you can increase your ad budget or hire more salespeople to increase sales. If you’re tracking average customer lifetime value as a KPI, you can improve customer service or the frequency and quality of customer communication in order to keep customers around longer.
In contrast, net margin is generally not a great KPI because it’s so complex. If you want to improve net margin, you could increase sales, decrease expenses, try to bring down COGs, or simply delay depreciation expense. It’s not clear which action is best and how it might impact other areas of the business.
What should a KPI track?
KPIs should track your progress towards or vs a goal. Before designing a set of KPIs for your organization you’ll need to figure out what the steps towards your goal are and then select KPIs for each step. For example, let’s consider the case of an e-commerce website which is attempting to drive business through advertising. Without getting overly detailed, we can easily identify some of the main steps along the way to a sale and their common corresponding KPIs:
- A prospect clicks on an ad and lands on a product page (click-through rate, describes how effective your ad is)
- The prospect adds the product to the cart (add-to-cart rate, describes how effective your web copy and UX is at getting a customer to begin the purchase process)
- The prospect checks out and buys, converting to a customer (cart abandonment rate, describes the number of customers who were interested enough to ad a product to cart but then didn’t follow through to sale)
See? Setting the right KPIs can make it surprisingly easy to figure out which areas of your business to work on.
KPIs need context through comparison
If I told you, “Our gross margin was 52% this month,” is that good? Bad? What’s the context? It’s virtually impossible to tell if a number is good or bad without grounds for comparison. There are three main methods of comparison to consider when building a set of KPIs:
1. vs Prior Period
A prior period is the most basic form of comparison and easiest to understand. Were sales up vs last month? Last year? It’s easy to see which direction your business is going by comparing important accounts on the income statement or balance sheet against prior periods.
2. vs Model ( also known as Plan, Forecast, or Budget)
Once you’re out of the startup phase of your business and focused on long-term growth, going up vs prior period may not be enough, especially if you’re looking for external financing! You’ll undoubtedly already be experienced with building a budget on some level, but it may now be time to put a more sophisticated financial model together. Once you have a model in place you’ll be able to compare results vs your model. This is called variance reporting. Instead of answering, “How did we do vs last month?” you’ll now be able to answer, “How did we do vs our forecast?”
3. vs a Benchmark
Some types of metrics are only useful with an external basis for comparison. Let’s go back to our margin example. If I told you, “Our gross margin was 45% last month,” is that good or bad? First, we’ll look to prior periods. But what if gross margin had been steady at 45% for the last several months? Since that doesn’t help, we can compare to our financial model. But what if the budget had been predicting 45% all along? That may tell us we’re on plan, but it still doesn’t tell us if the gross margin is good or bad. However, what if the business we’ve been looking at is a McDonalds? When we look up average gross margin at other franchises, the average is 51%. Then we know our margin is lagging the average by 3% and needs some improvement! Industry averages and similar businesses are great for benchmarking.
I recommend graphing your KPIs in a way you can see all three of these comparisons if they apply. I generally default to a simple line chart. A simple way of graphing KPIs on a line chart is shown below:
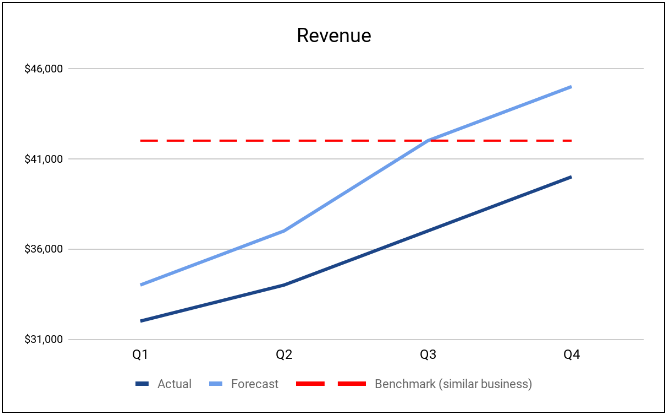
From this graph, you can see that revenue is trending up, but just a little behind the forecast. The forecast is predicting revenue to go above average vs similar businesses, and it looks like it will get there as long as the trend holds.
KPIs can sit at many levels
Since KPIs are descriptive of progress towards goals, recognize that there can be KPIs at all levels of the organization. There will always be company-level goals, normally set and monitored by the executive team. However, in a large organization, those goals can seem awfully far away.
Departmental, team, or individual goals may seem a lot more relevant to employees at the lower ranks of the org chart. In the case of a department head, they’ll need to monitor KPIs for their department, but they may also want to monitor employee-level KPIs so they can accurately judge their team’s performance.
As an example, think of a customer service call center. The department head will undoubtedly have some sort of KPI for average hold time for the department. If the hold time is low, the department is staffed adequately; if the hold time gets too high the department may need some additional staff.
Knowing that not all phone agents are created equal, the department head will also want a KPI for phone volume at the agent level. This will show which agents are taking an average to an above-average amount of calls and which agents are lagging behind the pack. Lagging agents may need extra training or corrective action, while workhorse agents might get a bonus!
KPIs require accessible data
Before committing yourself to a specific, newly brainstormed KPI think through how you will collect the data it needs and how time-consuming the process will be. You may have thought of the juiciest KPI in the world, but if you can't capture the data or if capturing the data will take a prohibitive amount of time or money, the KPI is just a fantasy.
KPIs require accurate data
Another thing to consider is whether or not the data will be accurate. A great example of this is employee time tracking. There have been times in my career where having a log of how a given team is spending their time would have been tremendously useful in identifying operational time-sucks. The challenge, though, is that the data needs to be self-reported.
For it to be useful, I would have preferred using 15-minute increments, but I knew the team would never be able to record their time every 15 minutes without undue hardship and resentment. I tried to roll out reporting in half-hour blocks instead, but quickly found that people wouldn’t fill the logs out in real time. They’d wait until the end of the day and then fill them in from memory, which wasn’t accurate.
Ultimately, I had to give up on the KPI entirely. The team didn’t like the interruption it created to record their time throughout the day and frequently forgot. If they filled it all in at the end-of-day, the data wasn’t accurate or refined enough to be useful. If I had thought it through in advance well enough I could have predicted some of this and saved us all some time by taking a different approach.
KPIs need a large sample size
As a quick note of caution on KPI data sets, make sure to obtain a reasonably large and diverse sample size of data before making decisions based on the results. For example, some level of customer satisfaction KPI, like Net Promoter Score (NPS), can be tremendously valuable.
However, if you only get a few surveys back from customers it would be a poor idea to assume they’re representative of your entire customer base. Maybe your best customers are more likely to return surveys and skew the results too positively. Or maybe your upset customers are most likely to return surveys, skewing the results the other direction. While any customer survey is valuable for intervening with that specific customer, only generalize actions to segments of your customer base if you’ve received enough feedback to feel it’s representative of the larger population. This rule applies to any kind of data; make sure you have enough before making decisions.
Subjective data is fine, but make sure to trend it
Objective data, like revenue in a given time period, count of web visitors, and cost of customer acquisition are always solid, reliable data points so long as you’re capturing the data accurately. Subjective data, however, can be a bit more tricky to rely on. There are some people who go out of their way to avoid subjective data, citing the unreliability of the data points.
Think about a subjective data point, like a daily employee satisfaction survey (this is just an example, not a recommendation!) based on the question “On a scale of 1 to 10, how happy are you with your job today?” There are obviously a lot of things which could be impacting a team member’s answer. Maybe they went on an awesome date the prior night and are going to answer 10 regardless of what’s really going on at work. Or maybe they found out they had bed bugs the night before, which would undoubtedly skew any question involving the word “happy” much lower.
On its own, that single data point isn’t reliable for much. However, if you trend the same data point over a long period of time, the trend itself can offer quite a bit of value. Over a longer time period, you can assume the extraneous ups and downs average each other out, leaving a more reliable metric based on the trend. Is the team member generally happy or unhappy? Is their happiness increasing or decreasing? How do they compare to the scores of other team members?
There is a lot of value to be found in trended, subjective data. Think about the KPI we discussed in the last example: Net Promoter Score. It’s a subjective measure, and one of the most important KPIs most companies can have! So feel free to leverage subjective data in your KPIs, just make sure it’s trended and you’re looking at average or directional results, not single data points.
How many KPIs are too many?
When you realize the value of a dashboard of KPIs, it’s easy to go overboard, at least it was for me. One time, when in charge of a technical call center, I had one of my directors put together a robust suite of metrics and KPIs, pulled from our VOIP phone system, ticket management software, and employee time logs. The reports were great! They offered more visibility into the department than we had before and made decision making more accurate and far easier. It was months into the project before I found out he had been spending 8 hours a week compiling the data!
Your KPIs, metrics, and reports should add value but not cripple your team with data collection and formatting work. I learned the lesson from this experience that less can be more with KPIs. Pick the ones you’ll use regularly and eliminate the ones you’ll only look at occasionally or not at all. And, of course, you can always change them up over time as your business evolves. In fact, it’s a good time to review your KPIs after quarterly or annual strategy meetings. While all your new goals are fresh in your mind, figure out any KPIs you’ll need to add or subtract from your dashboard.
Cliff Notes Summary
When your business looks in the mirror, KPIs are staring back at it. It’s critical to have a dashboard of KPIs which make it easy to understand what’s really going on in your business. As you build out this set of KPIs, keep the following in mind:
- Your KPIs must be actionable, otherwise, they’re irrelevant
- KPIs track or describe your progress toward a goal
- Your KPIs need context to be meaningful
- KPIs can sit at multiple levels of your organization (company, department, team member, etc.)
- Ensure your KPIs have accessible and accurate data
- Make sure you have a large enough data set to make decisions
- KPIs can be based on both objective and subjective data
- KPIs are awesome but don’t go overboard